As of 7/27/25, the old EvE-Scout Forums are now offline until further notice.
Public:Katia63 ProjectW FirstJump
Project “W” First Jump Results
“If we knew what it was we were doing, it would not be called research, would it?” – Albert Einstein, Theoretical Physicist
10.09.yc118 (2016) J144135 System < D-C00202 Constellation < D-R00021 Region
What is Project “W”
I posted an observation I had made back in April yc118 (2016) that started off this research project that I titled Project “W”. There’s no rhyme or reason for the name, I just didn’t know what to call it. You can read more about that following this link. After my blog post, others came forward and said they’ve noticed similar things and offered suggestions as to what could be going on from there is something odd, to that’s the nature of randomness, and the way the brain works looking for patterns. I figured the only way to prove or disprove anything one way or the other would be to collect some data and do some analysis. So, Project “W” was born.
With the help of some of my Signal Cartel corp mates and friends, we spent about 3 months from April yc118 to June, collecting data while navigating wormhole connections. At first I had thought there may be some kind of lightyear limit between systems that could possible explain the oddity, but after Johnny Splunk reviewed the Thera data from the EvE-Scout site, he stated there didn’t seem to be a correlation. So, we proceeded with the data collection without a premise, just mainly interested in seeing if any data anomalies would present themselves.
The Project Team
Before we start the analysis of the data collected, I want to shout out to our Research Team. Special thanks to: Aiken Paru, Mirielle Asaki, Kobura Juraxxis, Mushroom Greene, Mynxee, Dr Zemph, Delaine De’Andre, Mark726, Saile Litestrider, Zecht Reddas, Forcha Alendare, Dorian Reu, Pileto, Jen Outamon, Mason Akiwa, Josca Aldent, Ashlar Maidstone, Stikkem Innagibblies, Dungeon Manager, Ozob Bozo, Andrew Chikatilo, Johnny Splunk.
Observed Connections and Doing the Analysis
A total of 663 connections were observed. Of those, 300 connections were via a known wormhole type which means we know what type of space and possible region was on the other side. This will become our dataset for this first pass on the analysis. Because of this measurable dataset, I choose to use the Chi-Square Goodness of Fit test.
The Chi-Square Goodness of Fit test is appropriate if the following conditions are met:
- Sampling method is simple random sampling. Our observed connections are equally likely to occur in our expected destination population (Regions). Passed.
- Our variable under study (connection type) is categorical (Regions). Passed.
- The expected value of the number of sample connections in each level (by Region) of the variable is at least 5. Failed. More data is necessary to fulfill this requirement, however, we’ll still take a look at what we do have, if nothing else, it’s a place to start.
The Special W-Space Class & Regions
As well as excluding the 363 exit wormhole connections and connections where the type wasn’t recorded, I also excluded Class 12 (Thera), Class 13 (Frigate sized accessible systems), and Classes 14 through 18 (Drifter wormholes) because each one are in their own region and therefore, when you find one of those connections, it’s a 100% chance you are landing in that region of space.
Determining the Expected
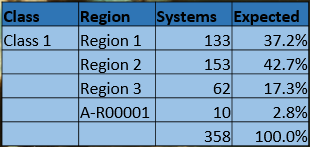
By knowing the signature type, we know the type of space and possible region where the destination is likely to be. For example, a wormhole connection with a type of E004 will connect to a Class 1 wormhole. We know Class 1 wormholes constitute Regions 1, 2, 3, and A-R00001. We know how many systems are in each region and assuming our hypothesis that your chances of exiting in each region is equally distributed, we can compute the probability. For example, from our chart, you can see when finding a connection that leads to a Class 1 wormhole, there’s a 37.2% chance of exiting in Region 1, 42.7% in Region 2, and so on.
The following two slides you can see the K-Space and W-Space expected distributions by region.
Class 1 Chi-Square Goodness of Fit Test
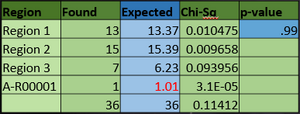
Let’s get to the analysis. I started with Class 1. Above you saw our expected distribution. To the right, you see that we found a total of 36 connections leading to Class 1 wormholes. If we take that total and apply our expected distribution against it, you see that for Region 1, we found 13 and expected to find 13.37. Region 2 we found 15 and expected 15.39, and so on. Running the data through the Chi-Square calculation we measure the difference between the found and expected, we sum up those values from each region, then compute the p-value or probability which is basically the likelihood that our observation data set comes from the same population as our expected data set. In this case, there’s a 99% probability we have a match.
Since the p-value of 0.99 is greater than the significance level of 0.05 (our measuring stick to find the exceptions), we accept the null hypothesis. The TLDR is connections that lead to Class 1 wormhole’s are equally random to the destination systems. In other words, it appears to be randomly determined.
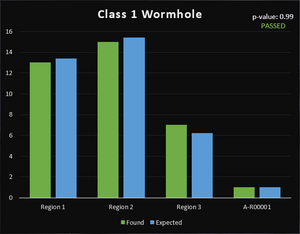
Please note, however, that we fail to meet one of the 3 conditions for this test to be valid, we only have 1 observation for region A-R00001 and we need a minimum of 5. In this case, the p-value is so strong and the observations are close overall, I feel more data gathering will only strengthen this result.
Seeing this I was both elated and disappointed. Fantastic! I thought, the test works and wormhole space connections are truly random… well dern, I was hoping to see the hypothesis fail, meaning there’s favoritism between regions of space, non-randomness if you will. Well, we have this data, let’s keep looking.
What about the other wormhole classes and known space…
The next two slides you can see the test results for other wormhole and known space regions. The p-value’s vary from 0.17 (which still passes), 0.33, up to 0.89. You can also see we’re missing a fair number of observations in various regions again reiterating we need more data. It’s still interesting to see that there does appear to be enough data to begin seeing connections appear to be random. As I said before, more data is likely to strengthen the results.
Who’s missing… ?
Did you notice there were two areas of space that were missing from the previous two slides? High Sec space and Class 5 wormholes. Take a look at the next slide. They both failed and not borderline either, they failed by a wide margin, High Sec with a p-value of 0.0000000005 and Class 5’s with 0.0003. Since the p-values are less than the significance level of 0.05, we reject the null hypothesis. The TLDR, connections to High Sec and Class 5 wormholes are not equally distributed. It appears to not be random.
Keep in mind, not enough data to confirm or deny these results, but isn’t it strange that it seems we have enough data for all regions of space to pass them except for these two? We do have observations from almost all of their respective regions, not the minimum, but still a fair sampling.
Wormhole Classes and Known Space by Chi-square ranking
So, who are our offenders? One region is clear as it jumps off the chart, Genesis, but are there others? In order to find out, we’ll sort our result set by their Chi-Square computation. For our class 5’s it was region E-R00024, the shattered wormholes for that class. The next slide shows us that it was Genesis and Molden Heath from High Sec.
What does it mean?
- Using a connection that leads to High Sec, the expected probability of landing in Genesis was 3%. Based on observed data, Genesis was 20%. (9 out of 45).
- Using a connection that leads to High Sec, the expected probability of landing in Molden Heath was 1%. Based on observed data, Molden Heath was 9%. (4 out of 45).
- Together, both Genesis and Molden Heath accounted for 29% of jumps to High Sec.
- Using a connection that leads to Class 5 wormhole space, the expected probability of landing in E-R00024 was 4%. Based on observed data, E-R00024 was 19%. (4 out of 21).
From a couple of chat sessions I had with my fellow corpmates when I presented these findings, the speculation was that Genesis is a favored region for Signal Cartel, because one of our offices is located in the Zoohen system. Because we don’t have enough data, it is possible this is at play. But what about Molden Heath and E-R00024? What’s special about them? Does that place doubt on the favoritism thoughts of the Genesis region because of Zoohen?
If not Signal Cartel bias, then what? We know Genesis is the home region for the EvE Gate. We know E-R00024 are the shattered wormholes for Class 5’s, but other regions have shattered wormholes. I did find out there is one unique system in the Class 5 shattered’s, J013146, a C5 Magnetar system with 7 shattered planets where we can find sleepers and Talocan Static Gates in the epicenter. Was this system perhaps where the cascade failure began? (Seems I need to find a historian). Is there a connection to the Eve Gate? But then what about Molden Heath? Is there something unique, different, or some observer favoritism going on?
Raw Data for the Anomalies
On this slide I wanted to present the data for the failed regions. I highlighted some commonalities among the entries, but it’s easy to see not enough data to draw any conclusions.
Conclusions
- To positively confirm these results, we need to meet the minimum conditions for the Chi-Square Goodness of Fit test of at least 5 observations per region in High Sec and Class 5 wormholes. More data is needed.
- The p-value results for both High Sec and Class 5 are way out of sync with the reminder of the findings, it seems unlikely the rejected result of the null hypothesis would be reversed with more data, but it is possible.
- Even allowing for the minimum conditions of the Chi-Square test not being met, there seems to be enough data to say something odd seems to be going on Genesis, Molden Heath, and E-R00024.
- If we assume that more data will positively confirm these results, then the majority of known wormhole type connections are equally random across their respective destinations, with the exception of our 3 mysterious regions.
- We know there’s something special about the Genesis and E-R00024 regions, but about Molden Heath?
Final thoughts
Even though we don’t have enough data (have I said that enough 😉 ) to confirm or deny these findings, I find it odd that it appears we have enough to see the trend that for the most part, connections to other regions are random, with the exception of Genesis, Molden Heath, and E-R00024. It could very well be favoritism for Genesis, but what of the other two regions? If nothing else, this study has only added to the mystery of wormhole connections and ask more questions than what we started with. I think further observations, data gathering, and analysis are warranted. How, without any bias or favoritism going on, will be the challenge.
Links
- W-Space – Why you not random?🔗 My blog post that really started Project “W”.
- Wormhole Type Database – a list of known wormhole connections and where they lead.
- Database of New Eden Systems – All K-Space and W-Space systems and their information.
- Project “W” Phase I Data – The raw data cross referenced with the above databases. Open to anyone who wishes to do their own analysis, confirm my results, or do your own test. I’m open and welcome anyone to do your own research with this data, it’s not going to bother me. All I ask is give Project “W” credit for the data gathered.
Comments
"I traded in Sugar Kyle’s trade hub in Bosena for 6 months or so, so I’m a little familiar with the area. Three things strike me about Molden Heath. First, only 10 of the 38 systems in Molden Heath are in high sec. So when you mentioned the high percentage of high sec connections into Molden Heath, I thought it quite odd. But Molden Heath isn’t unique in that percentage. Aridia came to mind off the top of my head and it has a lower percentage of high sec systems (10 out of 66).
The second is wondering if there is a connection due to the Seyllin Incident. The great Thukker caravan that disappeared and reappeared in Thera was lost in SL-YBS in the Great Wildlands. SL-YBS is 4 jumps from Egbinger in Molden Heath. Yes, it’s probably a coincidence, but who knows?
Finally, Molden Heath was home to planetary conquest associated with DUST 514 (whatever that term means). With your findings, I’m beginning to wonder why empyreans were fighting on the ground. I doubt that even they knew, to be honest, and why Molden Heath is significant.
I’ll stop now before I enter tinfoil territory." - Noizy
"I’m going to pick up where you left off and plunge into tinfoil town. I’m betting that these anomalous regions have something to do with Jove/Sleepers/Drifters influencing wormholes that lead to these systems to generate more often.
I had not known about the DUST 514 connection to Molden Heath. So that is an interesting data point. And we know that the soldier tech was harvested from Sleepers and that such tech also has a strong connection to the Other.
Do you recall the Macaper prophecy? The sixth event is cryptically described: “What was many now becomes one when one becomes four.” The 514 of DUST 514, maybe? And other recent Macaper events seem to have to do with appearance of Drifters.
That’s all I’ve got for now to connect Molden Heath more directly to the Jove/Sleepers/Drifters. I will be watching this with much interest as the new Empress is crowned and we continue to learn more about the Drifters." - Thrice Hapus
"This is interesting and I’ve been following your posts on this for a while. Either direction of this wouldn’t surprise me. CCP in order to optimize the calculation of where to move WHs might just use a hardcoded system. That’s possible. The other direction is they are using a pseudo random number generator and putting them where the RNG fairy says they should go.
You will need at least two impossible things to begin to predict the pattern. First, you’ll need the specific RNG algorithm they are using. Second, you’ll need the seed (if they are using a see) they are using in order tell where the RNG is in its series of random numbers. These are just the high level items, so the details will go into a very deep wormhole you won’t return from soon if ever.
I am curious what Johnny used to research the Tripwire data. Can you post a little on the technical details of that bit of meta-gaming?" - Professor Los
"Thanks for the feedback and excellent thoughts! We’d definitely need a lot more data to see that. It would be really interesting if we did get enough to start seeing those kinds of patterns. As for Johnny’s analysis, he didn’t share with me how he went about looking at the Thera data, so I honestly have no idea. I’d love to have the data, but I can understand sharing it might be perceived as breaking a trust of the EvE-Scout service, and I certainly have no problem with that. I’ve gotten a lot of feedback and thoughts about data collection and we may have a way in the works to collect a lot more data in phase II. Hopefully, it’ll work out and we’ll be able to start confirming or denying some things." - Katia Sae
